
Pitney Bowes Inc. (PBI) Q3 2026 Earnings Call Transcript
Pitney Bowes Inc. (PBI) Q3 2026 Earnings Call October 29, 2026 8:00 AM EDTCompany ParticipantsAlex BrownKurt Wolf - CEO & DirectorPaul Evans - Executive...
PBI is down 5.62% today. Volume is 3.44M vs a 30-day average of 1.66M (2.07x).
Pitney Bowes Inc. (PBI) Q3 2026 Earnings Call October 29, 2026 8:00 AM EDTCompany ParticipantsAlex BrownKurt Wolf - CEO & DirectorPaul Evans - Executive...
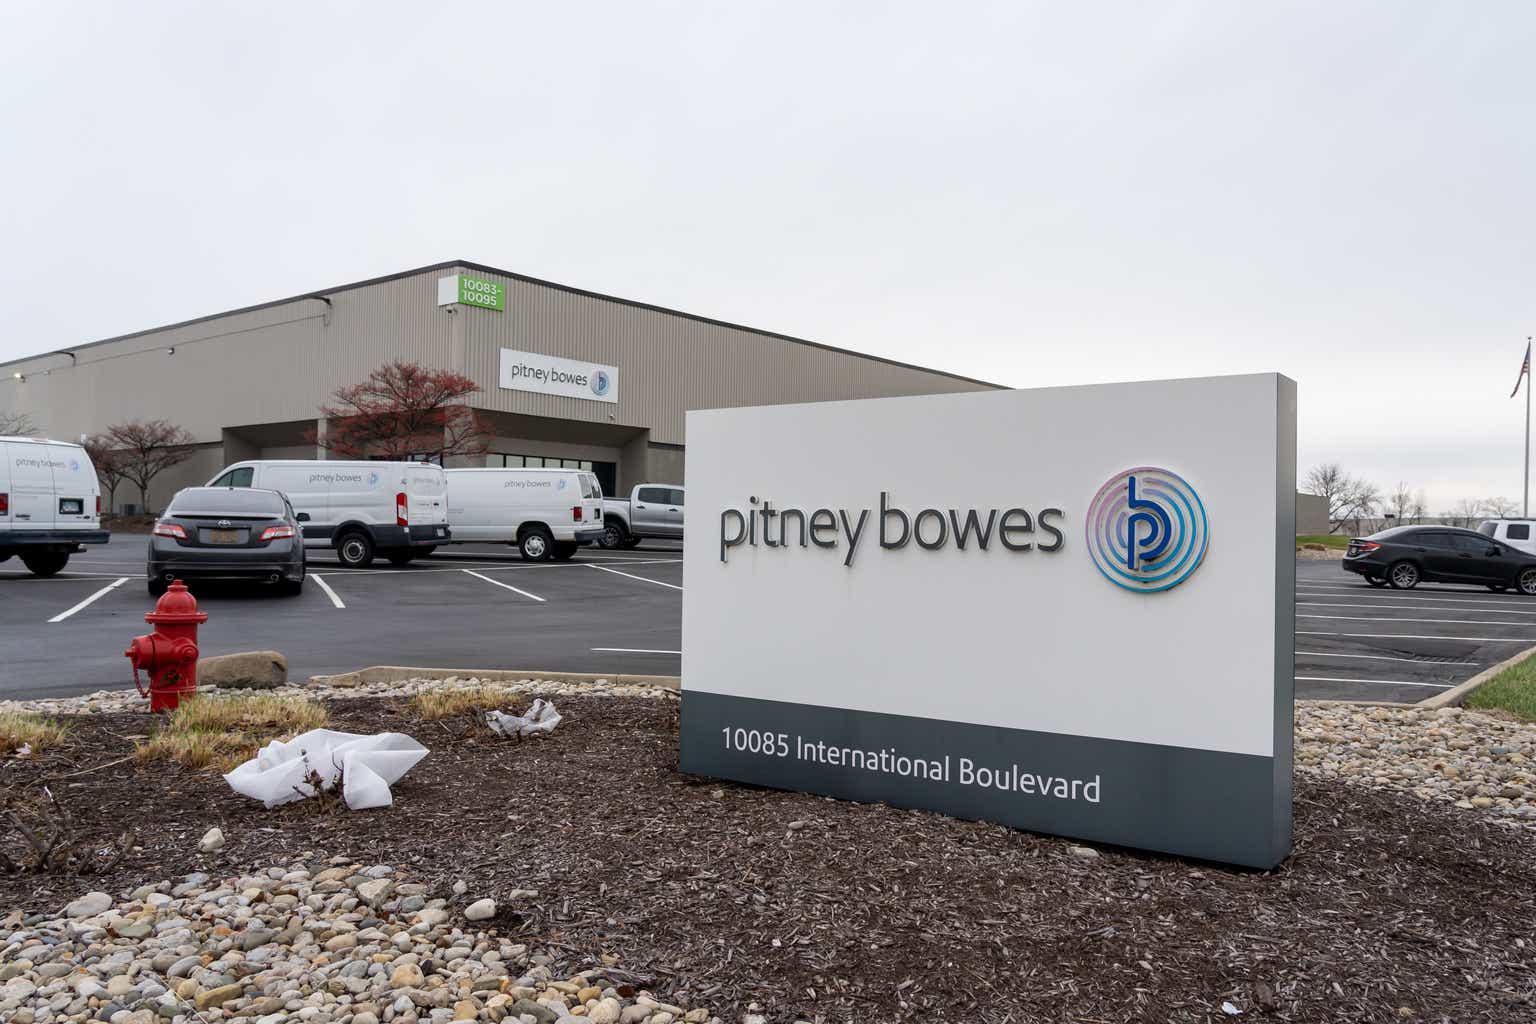
Pitney Bowes remains a buy as the turnaround is delivering tangible gains in cash flow, debt reduction, and capital returns. Learn more on PBI stock here.

Pitney Bowes Q3 2026: adjusted EPS beat and strong cash flow, revenue in line, but full-year sales guidance trails consensus; stock flat after hours.

Pitney Bowes (PBI) delivered earnings and revenue surprises of +16.67% and +1.83%, respectively, for the quarter ended September 2026. Do the numbers hold clues to what lies ahead…
(PBI) on Wednesday reported profit of $52.The Shelton, Connecticut-based company said it had net income of 37 cents per share.