
What Just Happened To T-Mobile Stock?
For questions about this article or underlying research, email help@trefis.com.
T is down 0.38% today. Volume is 59.34M vs a 30-day average of 47.99M (1.24x).
For questions about this article or underlying research, email help@trefis.com.

The Dow fell 1.2% as Brent climbed above $116 and the 10-year yield neared 5%. AT&T and T-Mobile sank on SpaceX’s reported cell tower talks, while cybersecurity and oil service st…
Key Stats for AT&T StockPrice change for AT&T stock in last 6 months: -20%$T Stock Price as of Oct. 23: $2152-Week High: $29$T Stock Price Target: $28__Now Live: Discover how much…
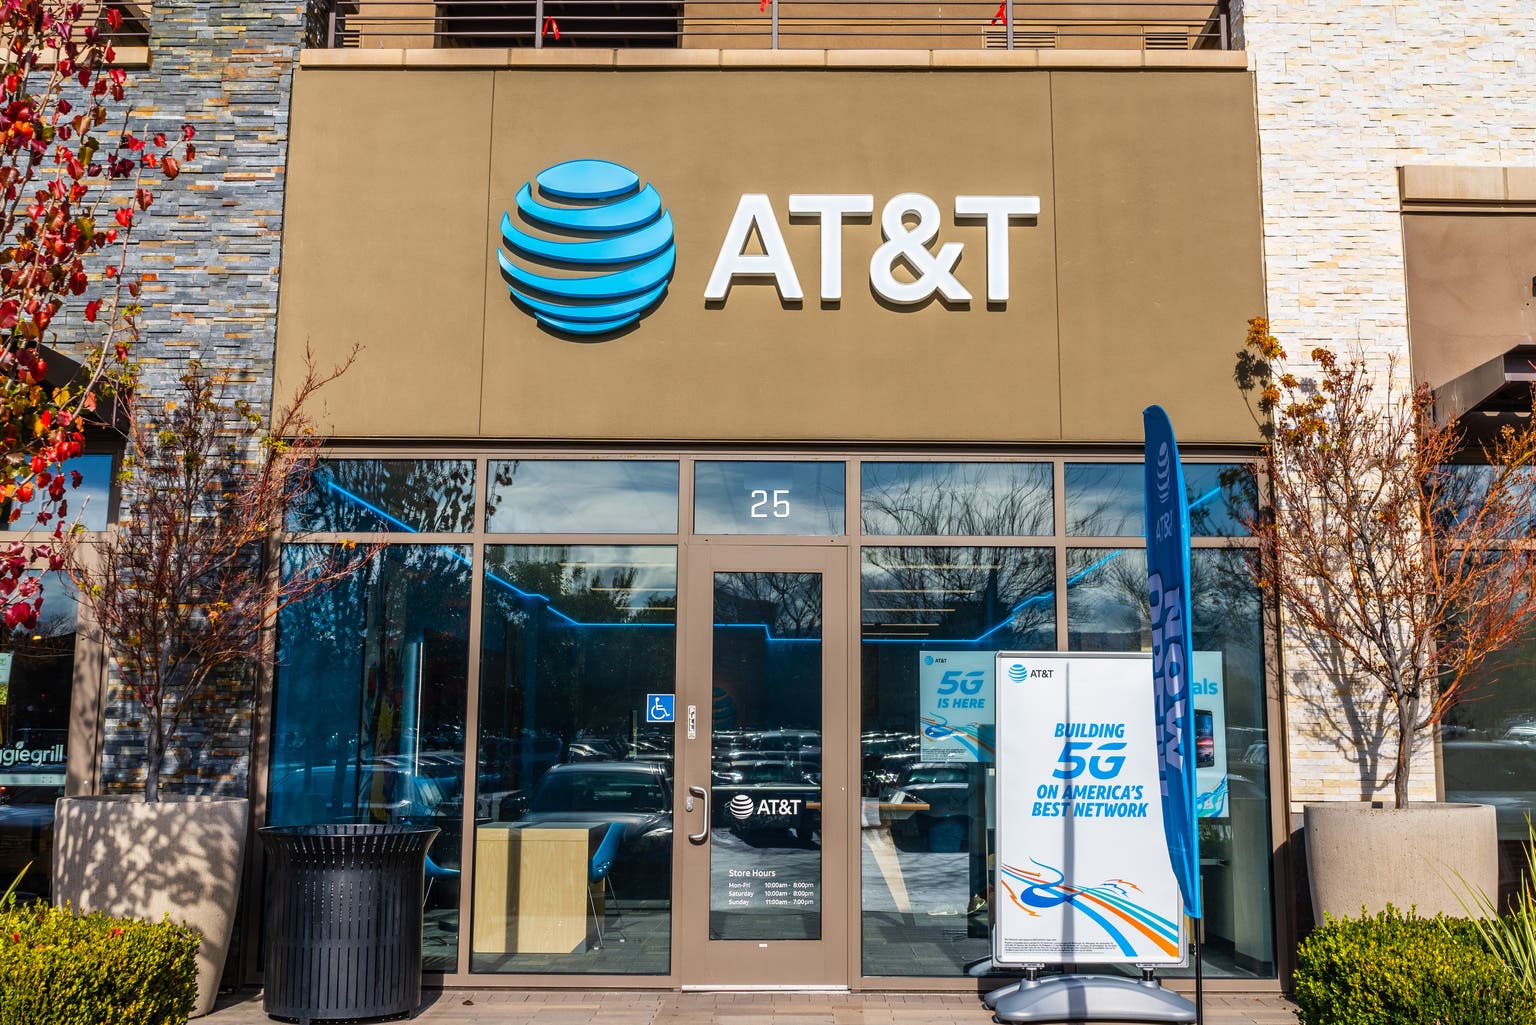
AT&T Inc. looks undervalued as fiber and 5G growth, resilient credit, and limited satellite threats support its outlook. Learn more about T stock here.